Value Assessment: PKX shows stable financial performance with historical free cash flow yield.
Growth Assessment: PKX provides some upside opportunity to the current trading levels with the lowest P/E multiple across the top 5 steel manufacturers.
Company OverviewDescriptionPOSCO engages in the manufacture and sale of various steel products. Its products include hot rolled products are used to manufacture structural steel used in the construction of buildings and bridges, railway rolling stocks, industrial pipes and tanks, and automobile chassis; plates, which are used in shipbuilding, structural steelwork, offshore oil and gas production, power generation, mining, manufacture of earth-moving and mechanical handling equipment, boiler and pressure vessels, and other industrial machinery; and wire rods that are used in the manufacture of wire, nails, bolts, nuts, and welding rods, as well as used in the manufacture of coil springs, tension bars, and tire cords in the automobile industry. The company also provides cold rolled coils and further refined galvanized cold rolled products that are used in the automobile industry to produce car body panels, as well as in household goods, electrical appliances, engineering, and metal goods industries; silicon steel sheets, which are used in the manufacture of power transformers and generators, and rotating machines; and stainless steel products that are used in the chemical, paper mills, aviation, automobile, construction, and food processing industries. The company also produces semifinished products, such as pig iron, billets, blooms, and slabs. It operates primarily in the People’s Republic of China, Asia, Japan, North America, and Europe. The company was founded in 1968 and is based in Seoul, South Korea.
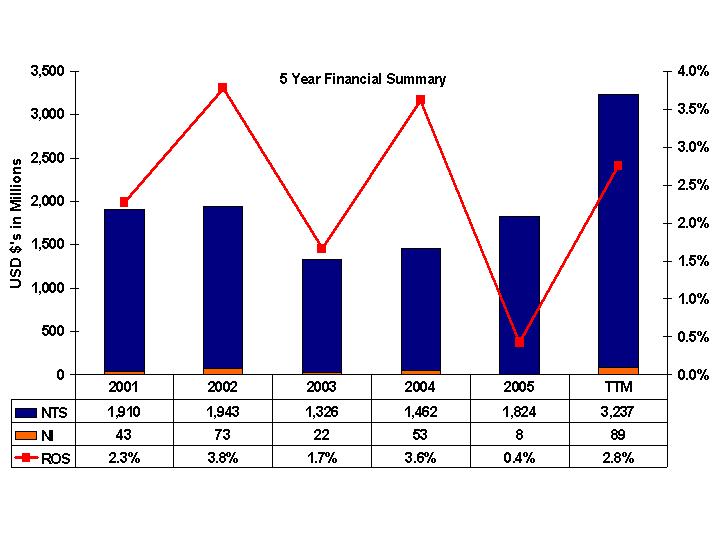
5-Year Financial History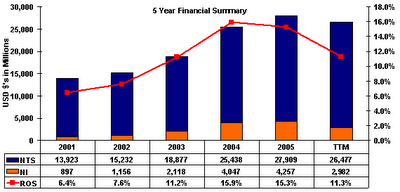
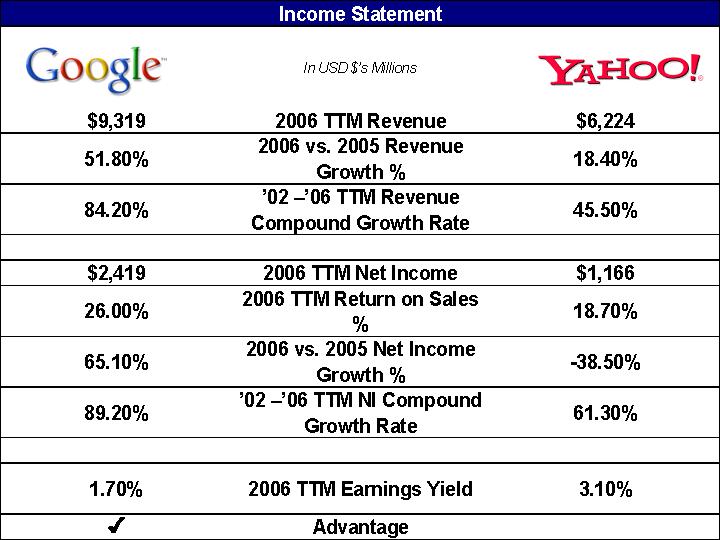
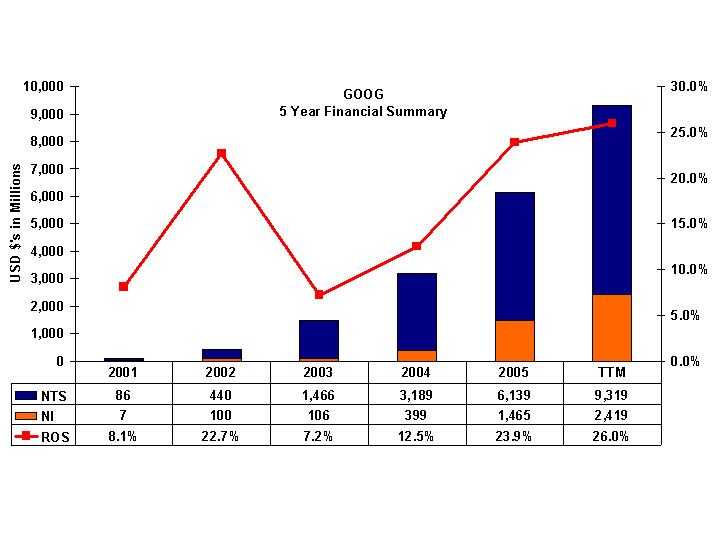
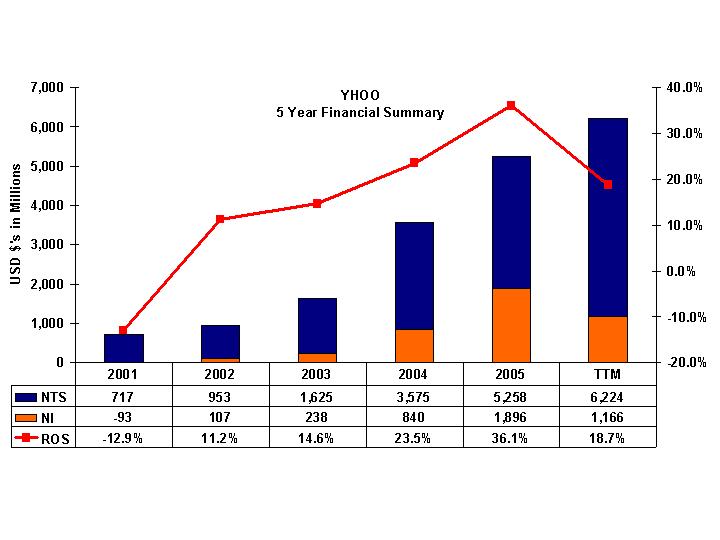
PKX has shown strong sales and income growth over the last five years with revenue and net income compound annual growth rates of 11.7% and 20.9%, respectively. This chart is reflecting that on a Trailing Twelve Months (TTM), PKX will be decreasing in revenue, net income, and return on sales mainly driven by the 2nd half performance of 2005 in the formula. When reviewing PKX’s latest SEC submission, it appears that revenue will be ~25.3 Billion dropping (4)%. Below is the link for the Q3 2006 SEC filing.
http://http//www.sec.gov/Archives/edgar/data/889132/000114554906001455/h00806exv99w1.htm
PKX has been able to improve the net income faster than the sales growth by the increase in the gross profit with keeping the SG&A expenses flat as a % to revenue. The effective tax rate for the company has stay flat throughout the 5 years at ~ 28%.
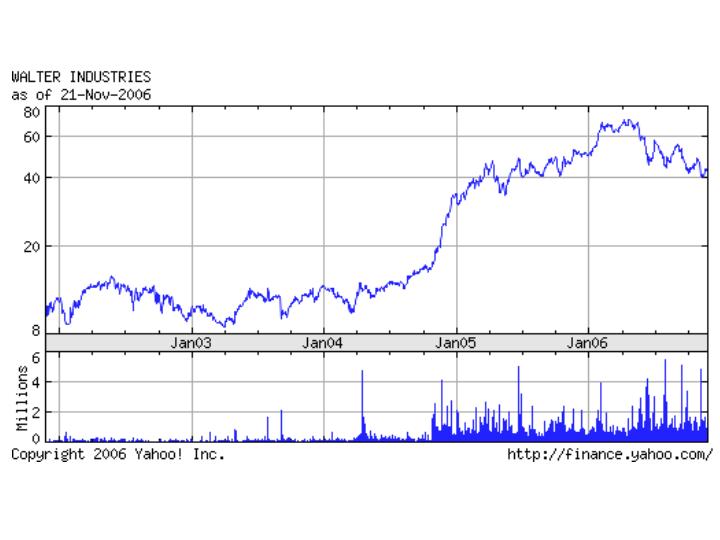
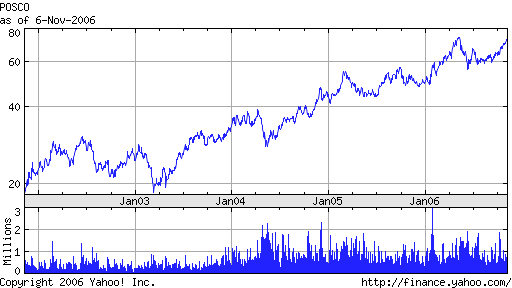
5-Year Stock Performance
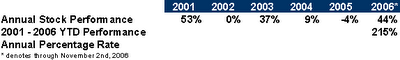
If you had invested $10,000 in PKX stock on January 2nd, 2001, your stock would be worth $40,802, representing a +300% return or 26.4% annually
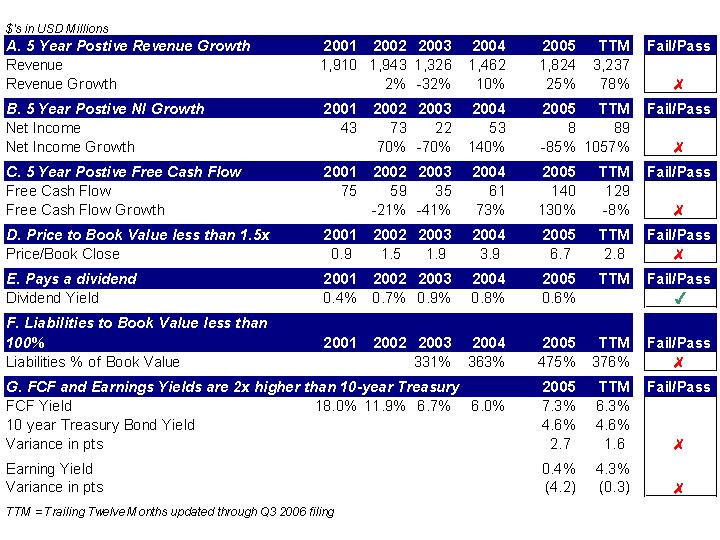
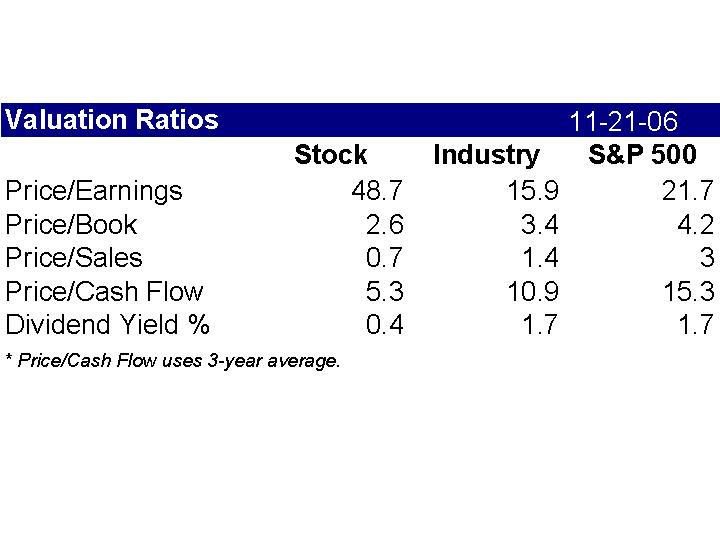
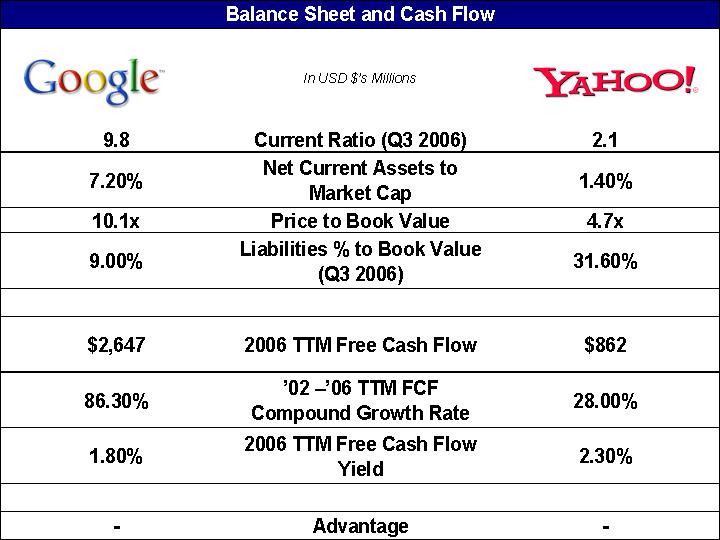
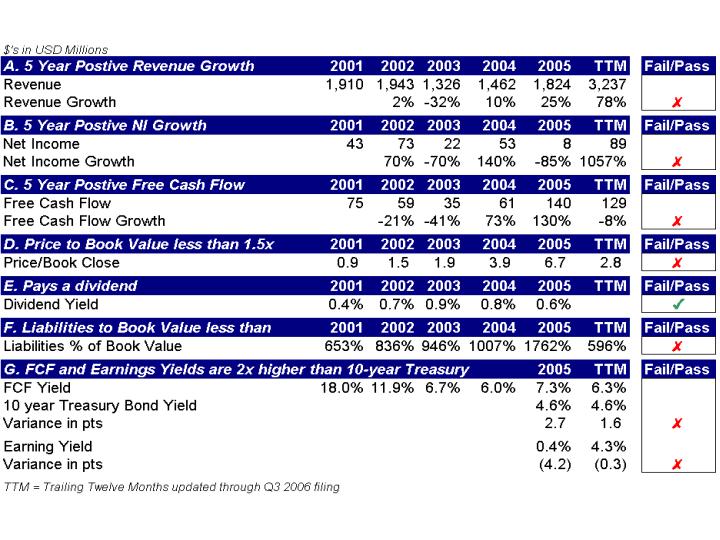
Value AssessmentI use an 8 criteria selection grid to help me assess potential value in any equity assessment. These 8 criteria are mainly driven from my readings of Benjamin Graham. The security doesn’t have to pass all of the below criteria to be selected for my portfolio, the more the better. Some of the major items that I focus on are Price to Book ratio (Criteria D.) and the earnings and free cash flow yields metrics (Criteria G.).
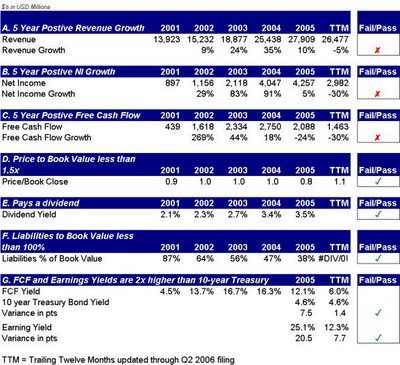
The value scorecard will show you that PKX is starting to show some annual growth decreases with revenue, net income and free cash flow going through the trailing twelve months. The company has a low Price to Book value, slightly higher in the TTM metric due to winning an anticipated large contract bid. The total liability is under the current book value and the firm pays a nice dividend yield. From a FCF yield, 2002 through 2005, the firm has provided at least 3x the return of the current 10-year bond rates, while slightly forecasting to be under in the TTM metric. I am not weighing the TTM metric too heavily since I am still trying to get comfortable with the quarter-to-quarter forecast.
Growth AssessmentWith my growth reviews of stock, I use a few different valuation techniques to surround my assumptions.
- 5 Year Discounted Cash Flow model with terminal value
- Industry Price to Earnings multiples
- Industry Price to Sales multiples
- Current Price to Earnings sensitivity
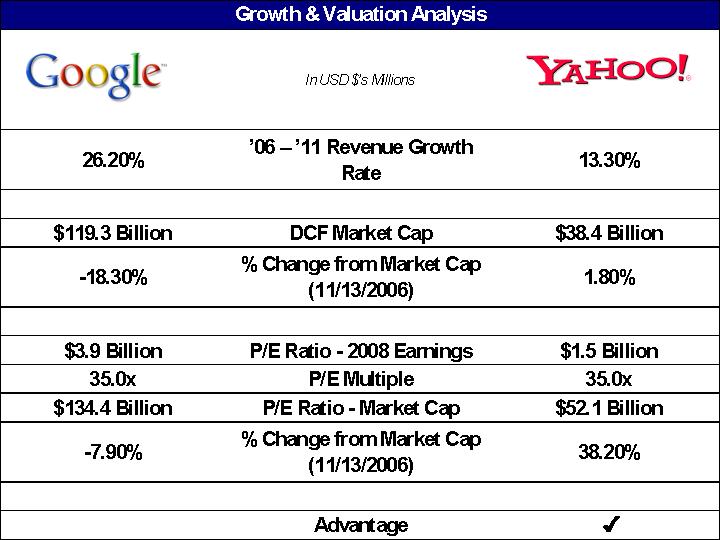
From a growth perspective, there is some upside to the current market cap.
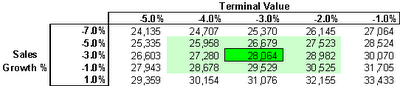
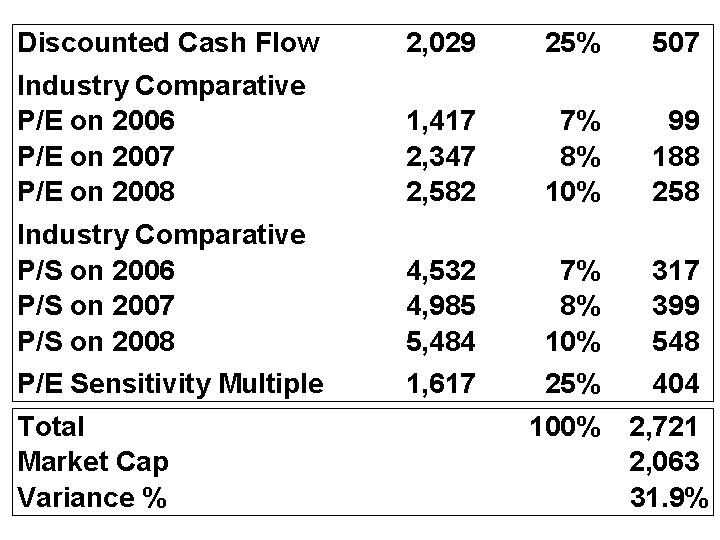
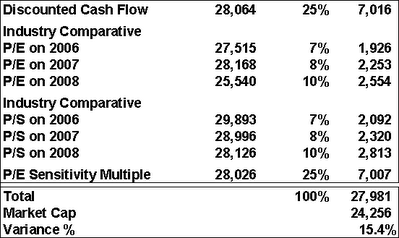 DCF Model
In the 5 year DCF model, I am assuming (3)% sales growth with no margin or FCF improvement. With a corresponding (3)% terminal value, PKX’s value is worth around $28.1 Billion.
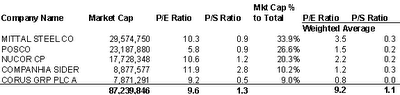
 Industry P/E and P/S multiples
I am currently using 4 competitors in the industry multiple comparison section. These competitors are mainly focused on the largest steel manufacturers in the world.
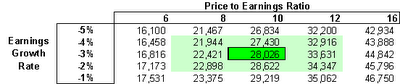
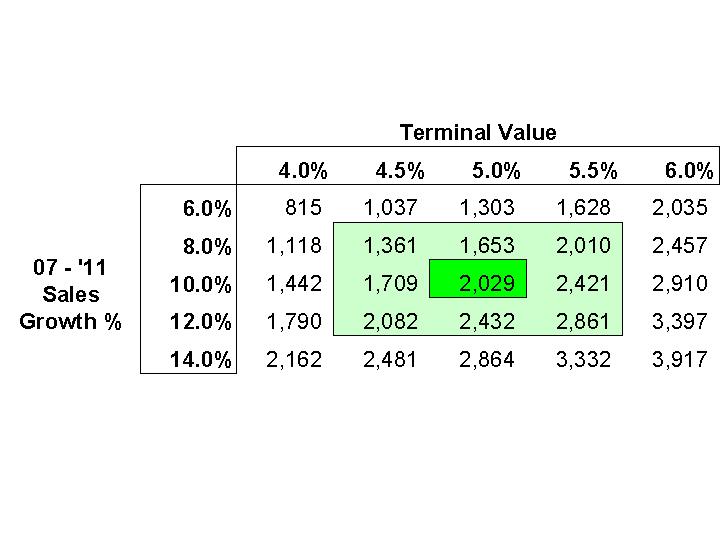
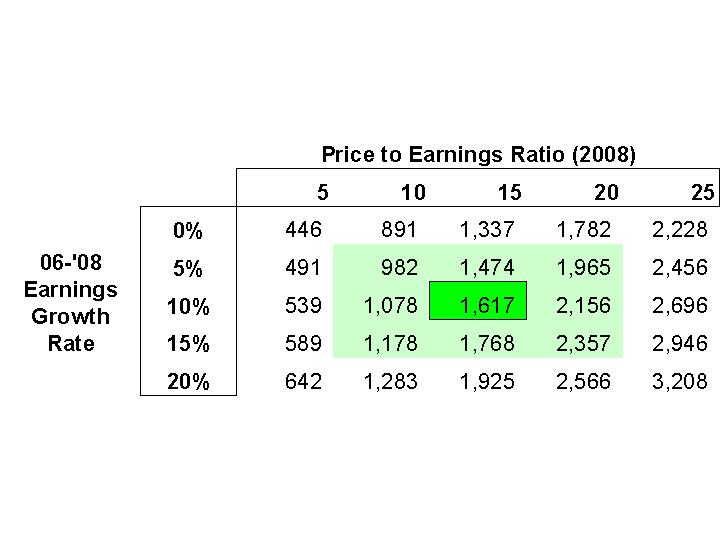
 Current P/E sensitivity
In the above industry list, you will notice the Posco is currently trading at 5.8x to earnings per share. Below you will find a sensitivity grid to future earnings growth compared to Price to Earnings metrics.
Sources:
Company Website
Yahoo Finance Website
Barchart.com
Morningstar Website


